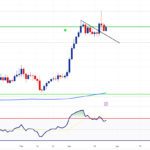
Taking a look at the 4hr chart above, price action is trading within a triangle formation. The bottom level of support is actually the ascending support on the daily timeframe.
Currently I’m waiting for price action to break out of this triangle but I believe a bullish breakout is more likely following the US inflation figures.
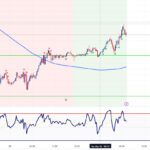
== DAILY TIMEFRAME ==

Taking a look at the daily timeframe above, it provides a better view of the ascending level of support. Stochastics is also in the oversold territory which gives me more reason to believe we may see a bullish breakout.
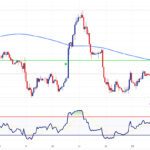
== WEEKLY TIMEFRAME ==

lastly on the weekly timeframe, we can see a strong support confluence which also makes me believe there’s a good chance of some bottoming action around these levels.
== IN SUMMARY ==
I believe this pair is likely to bottom