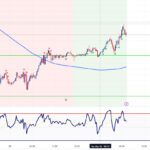
Starting with the 4hr chart, RSI is suggesting a bearish correction to the upside in spite of the bullish rejection candle.
Price action is still holding below the 200 SMA but I have my intraday bullish target set around that level.
Let’s now take a look at why I’m only long for the intraday.
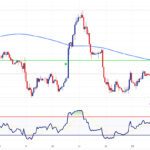
== DAILY TIMEFRAME ==

On the daily timeframe, the bulls are trying hard to defend the 0.85 handle. RSI is also hinting that a possible bullish correction may happen in the near future. However, the trend is still considered to be bearish as price action is still below the 200 SMA and trading within a bearish timeframe on the weekly chart.
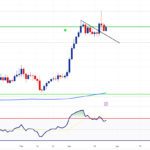
== WEEKLY TIMEFRAME ==

The weekly timeframe indicates further downside is likely as price action closed below the ascending support.
== IN CONCLUSION ==
I’m long for today but keeping my bullish target limited as I need to see further confirmation on larger timeframes that prices will climb higher. Until then, once we reach my target, I may consider looking for a sell setup.